Posts

5 Takeaways from Tableau

In October, SIGMA Data Scientist, Adam Smith attended Tableau’s coveted conference in New Orleans. Today he shares his biggest takeaways:

1. Mobile is now

One theme across many conference sessions included the importance of creating dashboards that work across screen sizes: desktop, tablet, and mobile. Fortunately, Tableau has a Dashboard Layout tool that allows you to create multiple versions of the same dashboard to optimize the display on different device sizes. Coming in 2019, there will be a default mobile view so that even if a dashboard never had a mobile version created, it will automatically transform into a mobile friendly view. This not only helps with older views but can make it faster to create custom mobile dashboards for your new projects.

2. Natural Language Processing (NLP) is next

Tableau’s mission is to help people see and understand data, but when they say people, they don’t just mean data scientists and spreadsheet wizards, they mean everyone. Even if you’re the type of person who thinks pie chart sounds like a tasty snack, they want to help you. An upcoming version of Tableau will have NLP built right in. This means you can write questions in English like “What are our sales in Q3 2018?” and Tableau will return the data in the best visualization. From there you can add additional text like “in the northeast region” to filter and drill-down or adjust it with the standard Tableau tools.

3. Interactive is best

I was reminded again that we need to make sure our SIGMA dashboards are interactive, flexible, and easy to use. It’s simple to put together a few charts, add a few filters and think you have a great dashboard, but it’s important to put yourself in the end user’s shoes and see what happens when you click on a bar chart (filter actions) and think “how can I make this dashboard work for a lot of people at once (parameters)?”
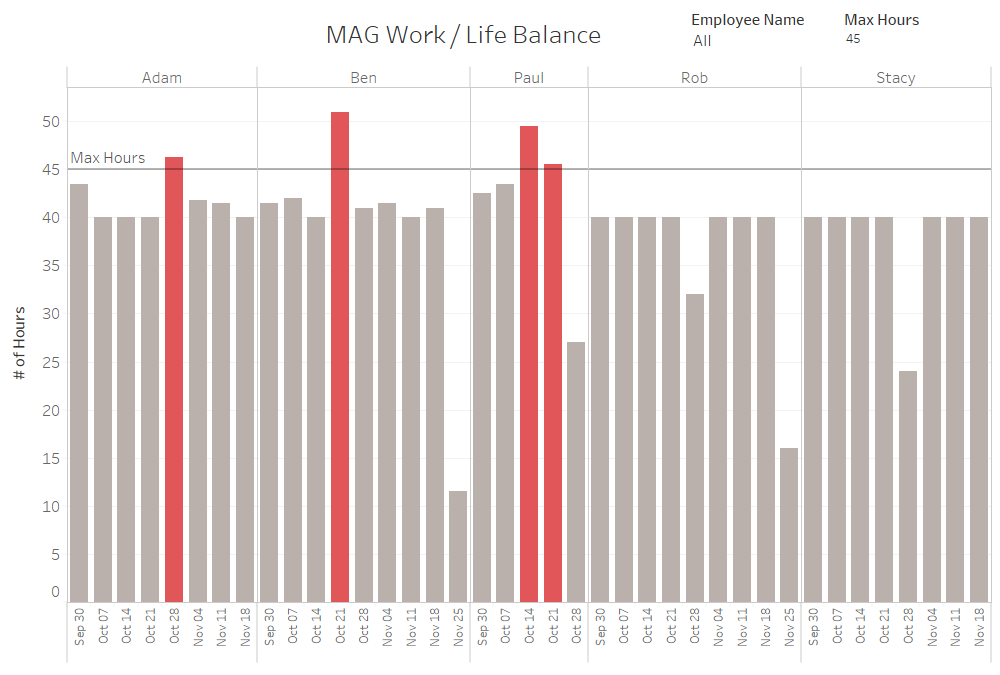
Here is a dashboard SIGMA created for SIGMA. It outlines work hours for each week and identifies when it gets off balance.

Of course you want to get feedback from your end user, but they may not know how to articulate their experience when it comes to options for interactivity.  Consider giving your dashboard to a colleague who is familiar with Tableau without telling them much about it to get feedback not only about interactivity, but anything else they may notice.  Looking at a dashboard with fresh eyes can help you really make it shine.

4. Who is this dashboard for?

Amid all the deeply technical sessions that I attend, I always try to make room for at least one session on soft skills.  Last year that was Design with the user in mind.  This year I checked out Start at the beginning | Gathering requirements for dream dashboards.  The presenter had lots of great ideas for making sure you’re building what your end user really wants.  Here are my top takeaways:

  1. Find the end user – Make sure you find who will really use your dashboard. Ask them open-ended questions about what they are trying to accomplish.
  2. Do it in their style – Use colors and chart types that work well for them.
  3. 3 x 1 rule – For every three things we do for our audience, we can do one thing for ourselves.
  4. Easter eggs – Put in something that will surprise and wow the user.

5. Fun!

There are hundreds of breakout sessions at Tableau, not to mention the hands-on training, Tableau Doctor, and insightful conversations in the hallways with fellow attendees. But it’s not all work and no play for attendees.  There’s plenty of fun to be had at receptions, mixers, and happy hours, and that’s even before you check out the jazz clubs on Bourbon Street! That is all just prologue to the last night of the conference and the party with 17,000 data nerds: Data Night Out.  This year it was at the Superdome.  We ran out onto the field where the Saints play each Sunday and had a huge, nerdy party.

The Tableau Conference is a great way to stay on top of what’s new and next at Tableau.  If you weren’t able to attend, but would like to learn more, many sessions were recorded and are available for free on the Tableau Conference website. And if you’re really excited, it’s not too early to sign up for 2019 when Tableau Conference returns to Las Vegas.

Adam Smith Speaks at the ABA Bank Marketing Conference

Check out Adam Smith delivering a great presentation on “Data and Machine Learning Worth your Time and Money”. Adam gave this speech at the American Banking Association’s 2018 Bank Marketing Conference in Baltimore, Maryland on September 24th. In this video he explores such customer segmentation, customer profiling and predictive modeling. He, also, wrote this blog on the same topic.


Please like and share the YouTube video and/or subscribe to our channel for great future videos and clips like this.

B2B Data 101: Our Approach to Data

Often we are asked: what makes SIGMA’s data solutions different than others’ services and platforms? Simply put, we provide the best way to display and visualize unique metrics that inform important decisions at your company. Our approach to data sets the stage for everything we do!

The way people currently talk about data can make it seem like a difficult topic to grasp. From clean data and dirty data, to smart data, big data and partner data, as well as geographic, demographic, or firmographic data. What do all these data phrases have in common? They’re not too difficult to understand, if you have the right data partner.

Our Data Process

Your company continues to collect data from your clients and prospects, yet this data is most likely “dirty” — incomplete or overloaded with duplicates and inconsistencies. At SIGMA, we use multiple methods to  “clean” your data, including ensuring each record is complete and not re-entered somewhere else. Once your data has been through the cleaning process, we enrich it further by adding third-party data sources like geographic data or partner data and statistical model scores for prioritizations that boost your data to “smart” status.

Before sharing the data with you, our top data scientists run a variety of analyses to present insights that inform and transform. These insights are more actionable than relying on a CRM or other marketing automation tools alone, and effectively point your sales team to the right clients, showing your company how to grow or alert you to clients that may be leaving. With decades of experience, our data scientists pore over your data looking for insights, opportunities, and solutions to your most-pressing problems. We demonstrate these insights via dashboards, which are fully accessible through your mobile device.

A Continuing Data Strategy

Most companies stop there, but at SIGMA we realize the untapped potential of unmeasured client and prospect data. We strategize with you to understand ways to mine future data insights from new data sources because the more clean and enriched data you collect, the more in-depth our insights become.

SIGMA’s data approach is varied and flexible, always ensuring quality data gets back to you in the form of useful insights to drive your business decisions. We will always work with you to maximize your data resources and transform your business.

For a deeper analysis of this topic, we encourage you to check out the eBook “B2B Data 101” here, or subscribe to our blog for more interesting posts related to data.

“Smart” Data Can Help You Align Marketing and Sales

Sales and marketing team alignment is more important than ever! Our partner Hubspot reports that companies that get marketing and sales working together not only generate 208% more revenue from their marketing efforts – but they see 36% higher customer retention and 38% higher sales win rates.

Where does data fit into this alignment? Capitalizing on customer intelligence and making insights and clean data available to Sales can lead to a more efficient and effective process that can motivate and fire up your sales teams. Get started by using these analytical techniques:

Create Common Sales Cycle Definitions Across Marketing and Sales

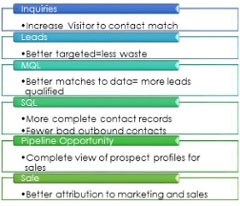
Your sales team lives and dies on what they call leads, but Marketing might have a very different definition. Adopt a common language for each stage and definition of the sales cycle. Whether you use Prospects, Inquiries, Marketing Qualified Leads (MQLs), Sales Accepted Leads (SALs) and Sales Qualified Leads (SQL) or some other set of opportunity ratings, collaborate to define each stage across Sales and Marketing –so you can all start working towards the same goals, and be able to understand each other’s measurements.

Data Dirty? Build the Case to Invest in Clean Data
Both sales and marketing hate dirty data – but how much revenue is it costing your company? Build some scenarios for better demand generation and increased close rates with better data – you’d be surprised how much lost revenue can be picked up with just a lift of 5%!

Here are some ideas for the metrics you might use:


Add a Score to Your Leads

Nothing will kill Marketing’s demand generation credibility faster than a bunch of unqualified leads being sent to the Sales team. Sales probably shouldn’t make a call until you know there is a budget and a timeline. Maybe lower cost sales channels like email or outbound telemarketing can be used to collect the missing data before a lead reaches an acceptable score. Alignment on the meaning of a “good lead” can really reduce friction and time to close.

Build a Common Definition of Your Segments – and Assign all Prospects and Customers

Building personas for web development won’t help the sales team much if they never see those types in the market place. Find real customer segments that purchase in distinct ways, and help the sales teams craft a USP for each segment that will give them a better shot at creating opportunities. Then, make sure each prospect and customer is assigned to a segment so sales can put that messaging to work on the ground.

Find Your Territory Gaps

Use your customer and prospect data to find the holes in territory maps where you have low coverage but high potential. You can often pull much more opportunity out of an area with better or more salespeople. Marketing often has the data to help make these decisions, but Sales is the team that needs to make decisions about coverage.

Use Purchase Likelihood Scores for Call Center Targeting

Outbound phone calls are not inexpensive and turnover in telesales can be high. Invest in reaching only the highest priority prospects by using predictive model scores in your call center. Focusing calling from the top down – best to worst prospects. This should cut the calls needed, improve team morale, and increase the success rate significantly.

Your marketing team should be able to add these types of smart data to customer and prospect records – and both Marketing and Sales can get aligned around your target and your critical asset – your data.

Creating Smart Data

If you and your team are spending time trying to wrangle all your various data feeds to find a way to create opportunities for your organization — there is a way to streamline your efforts.  You don’t need to find a home for, and a way to use all your data — just the “smart data”.

The flow of data is picking up speed for all marketers, and astute leaders are turning this data into better, more targeted and relevant sales and marketing efforts. But managing all the data from web platforms, marketing technology, mobile devices and the “Internet of Things” is often a daunting and time-consuming task. Rather than focusing on managing the big data flow, we think marketers should try to discover the relatively few data points that can really drive revenue – find your smart data and put it to work!

Start with Customer Segments

The simplest way to begin data-driven messaging to customers and prospects is by understanding that different segments may purchase your products for different reasons or in different ways. For the B2C client we find that demographics or lifestyle factors drive differences in product usage, and for the B2B client – different industry verticals, or other firmographic data mean different likelihoods to buy products and services.  Are you able to accurately identify these customer segments and analyze the differences in how they purchase or use your products and services?

Find Your Customers’ Trigger Point

Often times your customers will take some specific actions before they buy – or before they say good-bye (for example, checking their balance before paying off their car loan).  These actions should be seen as prompts that can be used to trigger communications to make the sale happen faster, or keep a customer longer. Using predictive models can score your customers and prospects for their likely purchase propensity – but the model itself can identify the behavior triggers that can be turned into automated messaging programs.

Build an Engagement Score

Measure how engaged your customers are with your brand by creating a score that will combine interactions across channels (email, satisfaction, service calls or visits to the store). Keeping it simple with a High-Medium-Low engagement scoring process, you can easily tell if some customers just need more love!

Add “Data Transformations” to Your Data Clean Up

When you combine data from multiple sources you might receive basically the same fields from the different data sources – although they may have different names and slightly different values. For example, “current age” is not as easy to update as “year of birth,” and may actually be the most useful data element for use in marketing campaigns. Build common rules, definitions and data naming conventions so the data can be easily understood, and used efficiently in marketing, sales and operations.  Data Transformations are key to making your data smart and actionable.

Trying to gain control of all the data generated by your marketing today can actually slow your progress to a more innovative data-driven approach.  Quality over quantity is key! Find your top ten “Smart Data” elements, use them to test more relevant multi-channel efforts, and build in more variables as you grow.

5 Ways to Rev up your Marketing Performance with Data-Driven Fuel

Customer Insights give great value to marketers when they can be activated through marketing and sales efforts that move the sales needle in the right direction. “Smart customer data” has emerged as a powerful strategic asset for the most successful marketing professionals – and the process of using this data to help define goals, audiences, campaigns, and tactics as well as measuring and analyzing performance makes marketers much more agile and responsive to rapidly changing consumer expectations and behaviors. If you recognize the need to accelerate your marketing with a more data-driven, analytical approach we recommend getting started with some of these ideas:

1. Assess When and How Your Customers Want Communication

  • Help customers let you know their communications preferences by making it easy on your privacy pages and in every reply form
  • Once they tell you their preferences – make sure you respond and respect their choices in your campaigns
  • Use message testing to persuade your customers to interact with you over multiple channels to build your understanding of what makes them tick
  • Keep track of what worked – optimize results and the satisfaction of your customers will grow

2. Use Insights to Drive Your Content Strategy

  • Different segments of your audiences will be interested in different types of content. Use insights about your segments in content development
  • Determine the types of marketing content and delivery format your key segments crave and respond to the most
  • When developing different content, consider where customers are in the sales cycle – are they gathering information and researching the category? Give them an overview of where you stand vs. your competition

3. Master Data-Driven Cross-Selling

  • Build a cross sell matrix and keep track of the most likely next-to-buy products for your customers
  • Analyze the typical time between purchases, and make sure you trigger a cross sell offer around the time your customers will be going back into the market.

4. Use customer data for digital micro-targeting

  • Use digital ad buying platforms to deliver ads directly to your individual customers – with segment specific messages
  • Push your current customer data into the platforms. They can build predictive models on the fly to find lookalikes
  • Drop digital ads to the same group of people just before and just after direct mail contact to see if you can boost your direct mail results
  • Work with your media buying team to pilot some of these innovative 1:1 digital techniques and find out where you get the biggest bang

5. Test into Offer-Optimization

  • Create offers with just enough incentive to get your customers and prospects to act
  • In addition to monetary, create offers that provide information or interesting content. Too many monetary offers can backfire and train your customers to wait for the best deal
  • Use a test and learn approach to get the most response from your product and service offering

Whether your aim is to fine-tune marketing targeting by selecting audiences that will deliver the greatest return, to deliver more relevant messaging, or to find the customers that are ready to leave (or those that are ready to buy) – the answers are often found in your existing customer data.  Analyzing data from inside your organization will build customer insights that speed up your marketing performance.

5 Ways to Take Your Marketing Measurement to the Next Level

Smart marketers have the luxury (and challenge!) of using more technologies and measurement tools than ever before, allowing us to project results and profitability, and look at customer and prospect behavior from different angles. While this should allow optimization like never before, campaigns are still often run “one-off,” with no more testing or optimization than before the MarTech boom. Habitually driven by short-term demands and the need to be responsive to quick changes in the markets, we often neglect to take the long view on marketing measurement to pursue long-term campaign improvement.  If you’re looking to boost your performance, it’s important to take a look at what drives your ROI and how to effectively develop actionable insights and optimize your marketing performance over time.

A few strategies to consider:

1. Get Alignment on your most important measure of success
Find one or two key measures (e.g., new customers acquired, incremental revenue growth, retained customers, etc.) and make sure each of your marketing efforts are designed to drive results that can prove out success for those specific measures.

2. Create a measurement template for every campaign – and stick to it
Determine how results will be measured and create a measurement template that can be repeated in all your campaigns – how does the response work, who is responsible for measuring and reporting on it, how does the information get into a centralized format, what is the next interaction after the initial response, etc. The more you standardize measurement, the less you have to figure out in the heat of the battle.

3. Standardize Closed-Loop Campaign Measurement
Track your marketing efforts all the way to the sale with sophisticated databases and ecommerce platforms, loyalty programs and smarter data matching. Create a consistent measurement template so ongoing reporting will be easier and have the ability to become standardized.  Rely on benchmarks to compare from campaign to campaign so you’ll be able to innovate more easily to boost results.

4. Create a Roadmap for Enhancing Your Marketing Measurement Methods
As you innovate and take advantage of new technologies (e.g. beacons) and/or new data sources (like machine data) your marketing measurement will also need to evolve over time. As you innovate, keep your focus on your key metrics for success. Plan to continuously enhance your measurement methods with the new data to determine the real impact of those innovations. Don’t forget to budget for updates to your database and the design of new measurement methods.

5. Create a Three Year Learning Plan
Often a “point-in-time” campaign analysis misses the big picture. Effectively monitor and evaluate the impact of your efforts over time by setting learning goals that can be tested and proved out over multiple waves of your initiatives. Build long term testing into every effort to keep trying to beat the benchmarks for your most key measures of success.

If you’re under pressure to improve marketing results, these five best practices can improve your operations and drive to optimize. We invite you to take the next step to change your marketing processes to get to repeatable improvements in your marketing ROI.

Is Your Data Solution Enough?

Scanning the headlines of the advertising and marketing trade press, it’s obvious that the marketing services industry is adept at keeping up with and pushing new trends in media, channel integration, and new marketing technologies. From conversations we have with many of our clients and agency partners it seems that many agencies struggle with what could be the industry’s most important challenge for the future; the need to understand and grapple with the mountains of data our clients want to use to achieve their business goals. Many agencies have put their toe in the water with data analysis and management — but is it enough?

Compounding this challenge is the continuing explosion of tech providers to fill in every white space in the marketing landscape. Each of these players is helping to drive the overwhelming amount of ‘Big Data’ that’s washing over the marketing landscape. Many of these tools are intended to allow us to optimize marketing spends and let individuals see unique messaging across a brand’s owned, earned and paid channels – but they end up creating even more silos of confusing data.

Today, working with client data as well as third party consumer information are essential skills for any agency seeking to build a successful brand. By offering effective data analytics and customer insights, agencies who can no longer keep their clients based on their creative ideas alone are able to productively drive business outcomes and effect corporate direction – making their agency / client relationships more valuable.

Client expectations are increasing every day, and keeping up with the demands of real time, data-driven marketing that resonates with their audiences and drives results requires a re-think about data and analytics. Once considered a luxury add on to basic agency services, these analytics and insights have become a necessary component in a brand’s overall marketing plans, most importantly in customer acquisition and growth strategies.

As a result, tech and data-focused agencies are increasingly in high demand. In a survey conducted by eMarketer, 75% of senior marketers surveyed said an agency with marketing data and analytics capabilities would be a deciding factor in agency selection.

Agencies now understand that in addition to their existing capabilities, data and analytic capabilities must be part of their solution. Today, clients expect their agency’s to leverage data successfully to advance the success of their brands. Once more agencies have successfully integrated stronger data and analytics skills they will be better equipped to be the marketing partner brands want and need.

Whether you build, or partner–flexing your data muscles will make your agency/client relationship stronger and more strategic.

So, what’s your data solution?

Partner with a data analytics firm that has depth at data science, best-in-class data tools, and the data governance and environment to integrate, manage, analyze, enrich, and ultimately construct actionable outcomes for your data – effectively building the strongest and most successful brand strategies.

Act now.