5 Takeaways from Tableau
In October, SIGMA Data Scientist, Adam Smith attended Tableau’s coveted conference in New Orleans. Today he shares his biggest takeaways:
1. Mobile is now
One theme across many conference sessions included the importance of creating dashboards that work across screen sizes: desktop, tablet, and mobile. Fortunately, Tableau has a Dashboard Layout tool that allows you to create multiple versions of the same dashboard to optimize the display on different device sizes. Coming in 2019, there will be a default mobile view so that even if a dashboard never had a mobile version created, it will automatically transform into a mobile friendly view. This not only helps with older views but can make it faster to create custom mobile dashboards for your new projects.
2. Natural Language Processing (NLP) is next
Tableau’s mission is to help people see and understand data, but when they say people, they don’t just mean data scientists and spreadsheet wizards, they mean everyone. Even if you’re the type of person who thinks pie chart sounds like a tasty snack, they want to help you. An upcoming version of Tableau will have NLP built right in. This means you can write questions in English like “What are our sales in Q3 2018?” and Tableau will return the data in the best visualization. From there you can add additional text like “in the northeast region” to filter and drill-down or adjust it with the standard Tableau tools.
3. Interactive is best
I was reminded again that we need to make sure our SIGMA dashboards are interactive, flexible, and easy to use. It’s simple to put together a few charts, add a few filters and think you have a great dashboard, but it’s important to put yourself in the end user’s shoes and see what happens when you click on a bar chart (filter actions) and think “how can I make this dashboard work for a lot of people at once (parameters)?”

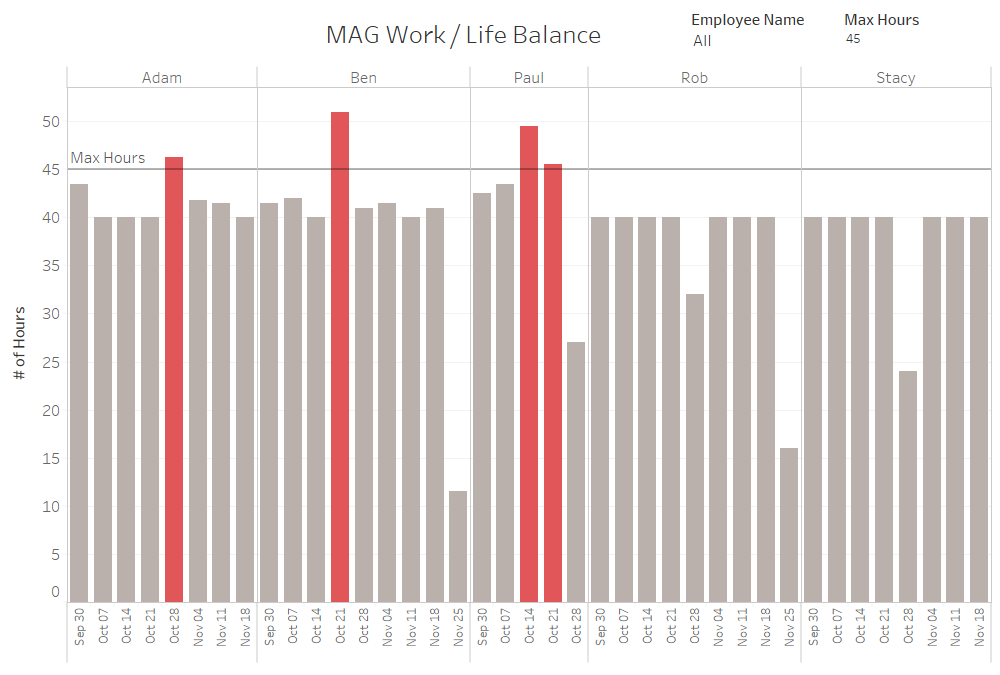
Here is a dashboard SIGMA created for SIGMA. It outlines work hours for each week and identifies when it gets off balance.
Of course you want to get feedback from your end user, but they may not know how to articulate their experience when it comes to options for interactivity. Consider giving your dashboard to a colleague who is familiar with Tableau without telling them much about it to get feedback not only about interactivity, but anything else they may notice. Looking at a dashboard with fresh eyes can help you really make it shine.
4. Who is this dashboard for?
Amid all the deeply technical sessions that I attend, I always try to make room for at least one session on soft skills. Last year that was Design with the user in mind. This year I checked out Start at the beginning | Gathering requirements for dream dashboards. The presenter had lots of great ideas for making sure you’re building what your end user really wants. Here are my top takeaways:
- Find the end user – Make sure you find who will really use your dashboard. Ask them open-ended questions about what they are trying to accomplish.
- Do it in their style – Use colors and chart types that work well for them.
- 3 x 1 rule – For every three things we do for our audience, we can do one thing for ourselves.
- Easter eggs – Put in something that will surprise and wow the user.
5. Fun!
There are hundreds of breakout sessions at Tableau, not to mention the hands-on training, Tableau Doctor, and insightful conversations in the hallways with fellow attendees. But it’s not all work and no play for attendees. There’s plenty of fun to be had at receptions, mixers, and happy hours, and that’s even before you check out the jazz clubs on Bourbon Street! That is all just prologue to the last night of the conference and the party with 17,000 data nerds: Data Night Out. This year it was at the Superdome. We ran out onto the field where the Saints play each Sunday and had a huge, nerdy party.
The Tableau Conference is a great way to stay on top of what’s new and next at Tableau. If you weren’t able to attend, but would like to learn more, many sessions were recorded and are available for free on the Tableau Conference website. And if you’re really excited, it’s not too early to sign up for 2019 when Tableau Conference returns to Las Vegas.


