Posts

SIGMA Insight: Personal Data Privacy in the Age of GDPR

In 2018, the European Union enacted a regulation on the protection and use of personal data entitled the General Data Protection Regulation, or GDPR. This resonates globally and has already spawned the first American privacy bill, the California Consumer Act, or CCPA. Both of them share the same idea: personal data should be treated well and kept sacred.

For our full take on the legislation, and how you can navigate your journey to compliance, download our Insight below.

We are providing this Insight as a framework for you to use as you consider the impact digital privacy laws have on your business goals. We present you with several facts and crucial actions you need to take as you confront data privacy challenges.

Here is just a taste:

What are these laws?

The most salient points of both regulations include protection of personal information, transparency, control, and remedy for misuse.

When should I be concerned?

While GDPR is already in effect in the EU, CCPA is approaching for California in January 2020, with similar regulations emerging in the US digital landscape soon after that.

Who needs to be involved?

Since nearly all employees touch some piece of sensitive information, they all should know about their companies’ privacy and security practices. The regulations also encourage consumers to manage their data with new tools. Meanwhile, companies can get substantial financial penalties for violating the regulations. But what can you do about it?

To rebuild the future, there are several possible steps to take.

  1. Build your team

Your robust data team and Data Protection Officer (DPO) should develop a formidable knowledge based on all things compliance, and a complete understanding of all those “who, what, where. how” questions about the data lifecycle.

  1. Update your data security model
  2. Test, test, test!

Implement and test to make sure what’s written in policy works in practice.

  1. Enable consumer controls

Customers should be empowered to direct how companies use their info, and how.

  1. Rethink action methodologies

Companies must try to comply with all data privacy requests, without bankrupting yourselves by doing so. Second, all companies in the custody chain need to communicate with one another. Finally, you need to prove that you’ve honored a data privacy request.

  1. Protect the custody chain

It’s up to compliant companies to eliminate the weak links in the chain of custody by denying work to non-compliant companies.

Attention to detail is needed as companies walk the path to compliance. If you can’t manage the process by yourself, SIGMA can lead you to your future state of complete compliance.


Download our SIGMA Insight


NAMA Post-Show

Last week, SIGMA team members Ruth Altpeter, Director of Account Services and Mallory Tabolt, Senior Account Manager attended the National Agri-Marketing Association (NAMA) Conference in Kansas City, MO. The NAMA conference is an opportunity for agri-marketing professionals to network and attend learning sessions highlighting new ideas and strategies specific to the agricultural industry. This year’s conference theme, “Onward and Upward” was displayed through exciting and interactive breakout sessions, networking opportunities and events.

Each year, the NAMA conference provides an important opportunity for our Ag portfolio teams to meet with clients and partners while brushing up the newest and greatest strategies for marketing in the ever-changing agricultural industry. Following this year’s conference, our team shared their takeaways from their time in Kansas City.

Takeaways from the Agri-Marketing Conference:

1. NAMA isn’t just a noun, it’s also a verb

As NAMA’s National President, Sheri Seger stated, “NAMA is also a verb.” As in, “we are going to NAMA the heck out of this conference.” For the agri-marketing industry, NAMA isn’t simply an organization or an event but is also a way to describe attendee actions and attitudes during the week-long conference.

2. Magicians can teach you about agri-marketing

Well, maybe not agri-marketing specifically, but entrepreneur, magician and keynote speaker, Vinh Giang led our team’s favorite session which focused on perception, influence and crafting solutions for “re-imagining and overcoming the impossible” when it comes to strategic marketing.

3. The secret to increasing exhibit booth traffic is puppies

As marketing professionals, we tend to consider ourselves creative individuals but at NAMA, The Sandbox Agency beat us all with their #Sandboxtotherescue campaign, which brought approximately a dozen puppies to their booth from a local shelter. The draw for attendees? Go to the booth and cuddle an adorable puppy while the Sandbox team talked about their services. We call that a win-win.

4. Hackonomy is a real word

According to keynote speaker Bonin Bough, hackonomy is defined as creating value by breaking things. Bough explained how as agencies, we need to break the norms and push through the traditional processes of what has already been done to take our marketing to the next level. Bough shared case studies demonstrating his hackonomy successes based on his experience working for companies such as PepsiCo and Modelez International (formerly Kraft Foods.)

5. Your ‘Top 5’ will define your future

Believe it or not the highlight of our team’s trip wasn’t the KC barbecue or the 80 degree weather, but rather a specific idea that was brought up at the conference. The idea that conference attendees were asked to think about was that professionally, you are a reflection of the top 5 people you spend the most time with. The concept forced our team members to reflect on who they spend most of their professional life with and what other types of individuals they may want to bring into their inner circle in order to meet their professional goals in the future. If you want to improve your public speaking and your top 5 does not include someone who excels in that area, you need find an individual with this quality and make a point to spend more time with them.

5 Takeaways from Tableau

In October, SIGMA Data Scientist, Adam Smith attended Tableau’s coveted conference in New Orleans. Today he shares his biggest takeaways:

1. Mobile is now

One theme across many conference sessions included the importance of creating dashboards that work across screen sizes: desktop, tablet, and mobile. Fortunately, Tableau has a Dashboard Layout tool that allows you to create multiple versions of the same dashboard to optimize the display on different device sizes. Coming in 2019, there will be a default mobile view so that even if a dashboard never had a mobile version created, it will automatically transform into a mobile friendly view. This not only helps with older views but can make it faster to create custom mobile dashboards for your new projects.

2. Natural Language Processing (NLP) is next

Tableau’s mission is to help people see and understand data, but when they say people, they don’t just mean data scientists and spreadsheet wizards, they mean everyone. Even if you’re the type of person who thinks pie chart sounds like a tasty snack, they want to help you. An upcoming version of Tableau will have NLP built right in. This means you can write questions in English like “What are our sales in Q3 2018?” and Tableau will return the data in the best visualization. From there you can add additional text like “in the northeast region” to filter and drill-down or adjust it with the standard Tableau tools.

3. Interactive is best

I was reminded again that we need to make sure our SIGMA dashboards are interactive, flexible, and easy to use. It’s simple to put together a few charts, add a few filters and think you have a great dashboard, but it’s important to put yourself in the end user’s shoes and see what happens when you click on a bar chart (filter actions) and think “how can I make this dashboard work for a lot of people at once (parameters)?”

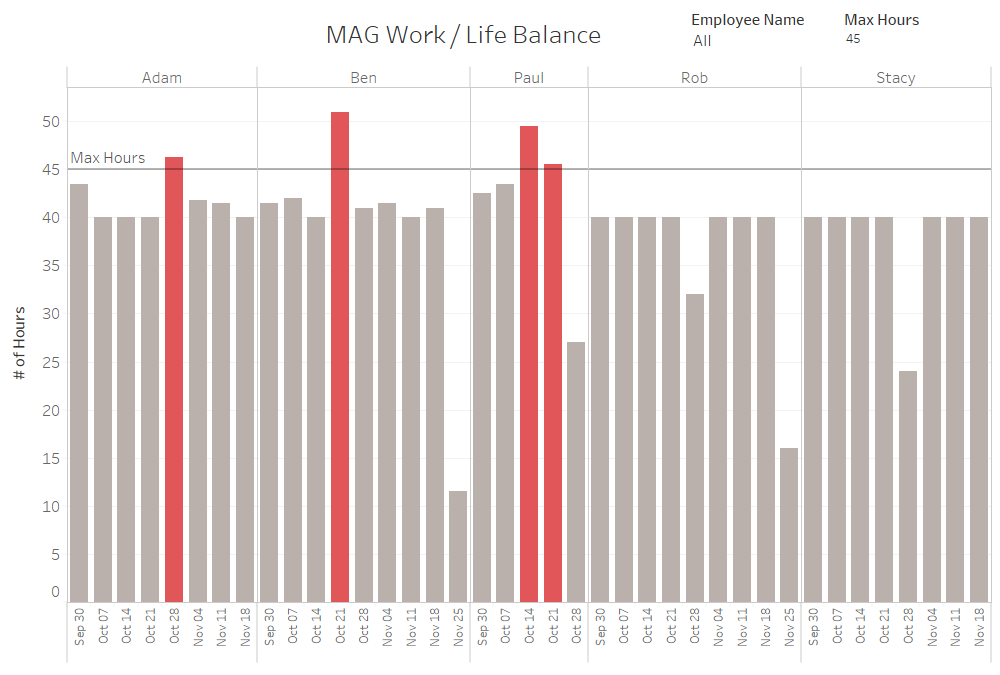
Here is a dashboard SIGMA created for SIGMA. It outlines work hours for each week and identifies when it gets off balance.

Of course you want to get feedback from your end user, but they may not know how to articulate their experience when it comes to options for interactivity.  Consider giving your dashboard to a colleague who is familiar with Tableau without telling them much about it to get feedback not only about interactivity, but anything else they may notice.  Looking at a dashboard with fresh eyes can help you really make it shine.

4. Who is this dashboard for?

Amid all the deeply technical sessions that I attend, I always try to make room for at least one session on soft skills.  Last year that was Design with the user in mind.  This year I checked out Start at the beginning | Gathering requirements for dream dashboards.  The presenter had lots of great ideas for making sure you’re building what your end user really wants.  Here are my top takeaways:

  1. Find the end user – Make sure you find who will really use your dashboard. Ask them open-ended questions about what they are trying to accomplish.
  2. Do it in their style – Use colors and chart types that work well for them.
  3. 3 x 1 rule – For every three things we do for our audience, we can do one thing for ourselves.
  4. Easter eggs – Put in something that will surprise and wow the user.

5. Fun!

There are hundreds of breakout sessions at Tableau, not to mention the hands-on training, Tableau Doctor, and insightful conversations in the hallways with fellow attendees. But it’s not all work and no play for attendees.  There’s plenty of fun to be had at receptions, mixers, and happy hours, and that’s even before you check out the jazz clubs on Bourbon Street! That is all just prologue to the last night of the conference and the party with 17,000 data nerds: Data Night Out.  This year it was at the Superdome.  We ran out onto the field where the Saints play each Sunday and had a huge, nerdy party.

The Tableau Conference is a great way to stay on top of what’s new and next at Tableau.  If you weren’t able to attend, but would like to learn more, many sessions were recorded and are available for free on the Tableau Conference website. And if you’re really excited, it’s not too early to sign up for 2019 when Tableau Conference returns to Las Vegas.

5 Ways Data Can Help Guide Your Digital Marketing

As digital marketers, we are always striving for higher open and click-through rates and increased page views, but often rely on instinct and guess-and-check methods to reach our goals, instead of making decisions based on results. That’s where data comes in.

Using data to guide your digital marketing strategy can take it from its likely generic approach to one that tailors messaging and places relevant content, based on actual findings, on the right platforms for your intended audience.

For help transitioning your digital marketing approach to one with data-driven strategy, follow our 5 tips below:

  1. Use Custom Audience Targeting – If you have first-party data from current customers, use it to develop customer profiles based on demographic and psycho-graphic factors. These profiles can help you develop tailored content based on factors such as age, gender, geography, and interests. Creating a targeting strategy with first-party data can help you market to current and potential lookalike customers with messaging they will likely interact with. If you don’t have enough first-party data, try using the targeting tools offered by digital platforms.
  2. Determine Your Distribution – Not all digital platforms will work with your digital strategy, because your target audience is not using all of them. Use your customer data to determine what social and digital platforms your audience is most likely to be using and start there. If you don’t have enough information about your current customers to make this determination, look at what platforms your closest competitors are using and see which fit your brand the best.
  1. Let Data Drive Your Content – Measuring the success of your content can be your greatest tool in determining what new content to develop. How will you know what content to create in the future if you don’t know what is resonating with your target audience now? Using data from your digital marketing campaigns can help you determine what content is working with your audience and help you determine what to focus on for future content. In addition, use this information to edit or reformat existing content that may not have performed the way you had hoped. Editing and reusing existing content based on your findings can save you time and development costs.
  2. Time Your Content – If you have been using data to track interactions with your content then you should have an idea of the time of the year, day of the week, and even the time of day your target audience is most likely to be online. Use this data to schedule your content during those peak times for a better chance of meeting your campaign goals.
  1. Make Reporting Easy – A major challenge for data-driven digital marketing is the time is takes to retrieve the data from all of the different distribution platforms that you are using for your campaigns. Website, email and pay-per-click marketing rarely use the same tool, which can complicate your reporting. In order to optimize your digital marketing data, consider combining it all into one dashboard that allows you to see trends that may be happening across multiple platforms.

To learn more about data-driven digital marketing or to schedule a demo to see our reporting dashboards, contact us at info@sigmamarketing.com or comment below.

B2B Data 101: Our Approach to Data

Often we are asked: what makes SIGMA’s data solutions different than others’ services and platforms? Simply put, we provide the best way to display and visualize unique metrics that inform important decisions at your company. Our approach to data sets the stage for everything we do!

The way people currently talk about data can make it seem like a difficult topic to grasp. From clean data and dirty data, to smart data, big data and partner data, as well as geographic, demographic, or firmographic data. What do all these data phrases have in common? They’re not too difficult to understand, if you have the right data partner.

Our Data Process

Your company continues to collect data from your clients and prospects, yet this data is most likely “dirty” — incomplete or overloaded with duplicates and inconsistencies. At SIGMA, we use multiple methods to  “clean” your data, including ensuring each record is complete and not re-entered somewhere else. Once your data has been through the cleaning process, we enrich it further by adding third-party data sources like geographic data or partner data and statistical model scores for prioritizations that boost your data to “smart” status.

Before sharing the data with you, our top data scientists run a variety of analyses to present insights that inform and transform. These insights are more actionable than relying on a CRM or other marketing automation tools alone, and effectively point your sales team to the right clients, showing your company how to grow or alert you to clients that may be leaving. With decades of experience, our data scientists pore over your data looking for insights, opportunities, and solutions to your most-pressing problems. We demonstrate these insights via dashboards, which are fully accessible through your mobile device.

A Continuing Data Strategy

Most companies stop there, but at SIGMA we realize the untapped potential of unmeasured client and prospect data. We strategize with you to understand ways to mine future data insights from new data sources because the more clean and enriched data you collect, the more in-depth our insights become.

SIGMA’s data approach is varied and flexible, always ensuring quality data gets back to you in the form of useful insights to drive your business decisions. We will always work with you to maximize your data resources and transform your business.

For a deeper analysis of this topic, we encourage you to check out the eBook “B2B Data 101” here, or subscribe to our blog for more interesting posts related to data.