

In October, SIGMA Data Scientist, Adam Smith attended Tableau’s coveted conference in New Orleans. Today he shares his biggest takeaways:
One theme across many conference sessions included the importance of creating dashboards that work across screen sizes: desktop, tablet, and mobile. Fortunately, Tableau has a Dashboard Layout tool that allows you to create multiple versions of the same dashboard to optimize the display on different device sizes. Coming in 2019, there will be a default mobile view so that even if a dashboard never had a mobile version created, it will automatically transform into a mobile friendly view. This not only helps with older views but can make it faster to create custom mobile dashboards for your new projects.
Tableau’s mission is to help people see and understand data, but when they say people, they don’t just mean data scientists and spreadsheet wizards, they mean everyone. Even if you’re the type of person who thinks pie chart sounds like a tasty snack, they want to help you. An upcoming version of Tableau will have NLP built right in. This means you can write questions in English like “What are our sales in Q3 2018?” and Tableau will return the data in the best visualization. From there you can add additional text like “in the northeast region” to filter and drill-down or adjust it with the standard Tableau tools.
I was reminded again that we need to make sure our SIGMA dashboards are interactive, flexible, and easy to use. It’s simple to put together a few charts, add a few filters and think you have a great dashboard, but it’s important to put yourself in the end user’s shoes and see what happens when you click on a bar chart (filter actions) and think “how can I make this dashboard work for a lot of people at once (parameters)?”
Here is a dashboard SIGMA created for SIGMA. It outlines work hours for each week and identifies when it gets off balance.
Of course you want to get feedback from your end user, but they may not know how to articulate their experience when it comes to options for interactivity. Consider giving your dashboard to a colleague who is familiar with Tableau without telling them much about it to get feedback not only about interactivity, but anything else they may notice. Looking at a dashboard with fresh eyes can help you really make it shine.
Amid all the deeply technical sessions that I attend, I always try to make room for at least one session on soft skills. Last year that was Design with the user in mind. This year I checked out Start at the beginning | Gathering requirements for dream dashboards. The presenter had lots of great ideas for making sure you’re building what your end user really wants. Here are my top takeaways:

There are hundreds of breakout sessions at Tableau, not to mention the hands-on training, Tableau Doctor, and insightful conversations in the hallways with fellow attendees. But it’s not all work and no play for attendees. There’s plenty of fun to be had at receptions, mixers, and happy hours, and that’s even before you check out the jazz clubs on Bourbon Street! That is all just prologue to the last night of the conference and the party with 17,000 data nerds: Data Night Out. This year it was at the Superdome. We ran out onto the field where the Saints play each Sunday and had a huge, nerdy party.
The Tableau Conference is a great way to stay on top of what’s new and next at Tableau. If you weren’t able to attend, but would like to learn more, many sessions were recorded and are available for free on the Tableau Conference website. And if you’re really excited, it’s not too early to sign up for 2019 when Tableau Conference returns to Las Vegas.
When organizations begin to standardize marketing measurements across their sales channels, business units and media, they will better track Brand Equity, Market Share, Marketing ROI, and Product and Customer Profitability.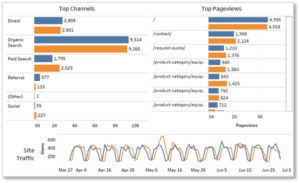
Here are 9 metrics every marketing organization can be measuring:
Any one of these metrics are difficult to measure without integrated databases to create definitions across channels. As data tools advance and simplify the process, marketers increasingly have the ability to measure such metrics easily. Today, smart decisions across the marketing organization can and should be commonplace.

Today, online purchases and order forms are rapidly replacing the face-to-face or voice-to-voice interactions that drove business and relationships in the past. However, computer-based interactions have also opened up new methods of understanding your customers, and have highlighted the need for a solid customer database. Key data provides crucial information to B2B companies about key traits, including purchasing style, to help you further engage, market to, and acquire more customers. Here are 3 data sources to help you better understand your customer:
1. Understand Customer Transactions
Ask yourself: what types of trends do you see when you look at your transactional data? Are your sales up or down from last year? What are the common products/services that are being purchased?
Simple questions like these can typically be answered using transactional data. Before you dive in too deep, try to understand the big picture of what is being sold and purchased as a whole.
Reflecting on the past helps better us in the present and look ahead to the future.
Your company may be tracking customers through Facebook with digital efforts such as retargeting.
2. Know Your Customers
It’s great to know what products or services your customers are purchasing, but being able to identify individual customers may be the single most useful tool available to the analytic marketer. For some companies, this is easy; their transactional data has the customer information by nature. For others, they rely on loyalty programs or survey data to make generalizations about the purchases their customers are making. In both cases, identifying new and returning customers will help your company understand current trends in their business.
Unsure how your company is tracking customer activity? Ask your sales team what information is being kept in a CRM; you may find that the information is already available.
3. Who’s Who – Tracking New vs. Returning?
Once the identity of the customer is known, you can begin to understand who is a new vs. returning as well as begin learning about the types of customers who might be interested in purchasing from your company. This is important data that can be found by bringing in outside data sources with demographic or firmographic information. Once you can identify key customer traits, you can create customer profiles for those who are likely to become new, those who are likely to leave, or those who are the most profitable.

If you and your team are spending time trying to wrangle all your various data feeds to find a way to create opportunities for your organization — there is a way to streamline your efforts. You don’t need to find a home for, and a way to use all your data — just the “smart data”.
The flow of data is picking up speed for all marketers, and astute leaders are turning this data into better, more targeted and relevant sales and marketing efforts. But managing all the data from web platforms, marketing technology, mobile devices and the “Internet of Things” is often a daunting and time-consuming task. Rather than focusing on managing the big data flow, we think marketers should try to discover the relatively few data points that can really drive revenue – find your smart data and put it to work!
Start with Customer Segments
The simplest way to begin data-driven messaging to customers and prospects is by understanding that different segments may purchase your products for different reasons or in different ways. For the B2C client we find that demographics or lifestyle factors drive differences in product usage, and for the B2B client – different industry verticals, or other firmographic data mean different likelihoods to buy products and services. Are you able to accurately identify these customer segments and analyze the differences in how they purchase or use your products and services?
Find Your Customers’ Trigger Point
Often times your customers will take some specific actions before they buy – or before they say good-bye (for example, checking their balance before paying off their car loan). These actions should be seen as prompts that can be used to trigger communications to make the sale happen faster, or keep a customer longer. Using predictive models can score your customers and prospects for their likely purchase propensity – but the model itself can identify the behavior triggers that can be turned into automated messaging programs.
Build an Engagement Score
Measure how engaged your customers are with your brand by creating a score that will combine interactions across channels (email, satisfaction, service calls or visits to the store). Keeping it simple with a High-Medium-Low engagement scoring process, you can easily tell if some customers just need more love!
Add “Data Transformations” to Your Data Clean Up
When you combine data from multiple sources you might receive basically the same fields from the different data sources – although they may have different names and slightly different values. For example, “current age” is not as easy to update as “year of birth,” and may actually be the most useful data element for use in marketing campaigns. Build common rules, definitions and data naming conventions so the data can be easily understood, and used efficiently in marketing, sales and operations. Data Transformations are key to making your data smart and actionable.

Smart marketers have the luxury (and challenge!) of using more technologies and measurement tools than ever before, allowing us to project results and profitability, and look at customer and prospect behavior from different angles. While this should allow optimization like never before, campaigns are still often run “one-off,” with no more testing or optimization than before the MarTech boom. Habitually driven by short-term demands and the need to be responsive to quick changes in the markets, we often neglect to take the long view on marketing measurement to pursue long-term campaign improvement. If you’re looking to boost your performance, it’s important to take a look at what drives your ROI and how to effectively develop actionable insights and optimize your marketing performance over time.

A few strategies to consider:
1. Get Alignment on your most important measure of success
Find one or two key measures (e.g., new customers acquired, incremental revenue growth, retained customers, etc.) and make sure each of your marketing efforts are designed to drive results that can prove out success for those specific measures.
2. Create a measurement template for every campaign – and stick to it
Determine how results will be measured and create a measurement template that can be repeated in all your campaigns – how does the response work, who is responsible for measuring and reporting on it, how does the information get into a centralized format, what is the next interaction after the initial response, etc. The more you standardize measurement, the less you have to figure out in the heat of the battle.
3. Standardize Closed-Loop Campaign Measurement
Track your marketing efforts all the way to the sale with sophisticated databases and ecommerce platforms, loyalty programs and smarter data matching. Create a consistent measurement template so ongoing reporting will be easier and have the ability to become standardized. Rely on benchmarks to compare from campaign to campaign so you’ll be able to innovate more easily to boost results.
4. Create a Roadmap for Enhancing Your Marketing Measurement Methods
As you innovate and take advantage of new technologies (e.g. beacons) and/or new data sources (like machine data) your marketing measurement will also need to evolve over time. As you innovate, keep your focus on your key metrics for success. Plan to continuously enhance your measurement methods with the new data to determine the real impact of those innovations. Don’t forget to budget for updates to your database and the design of new measurement methods.
5. Create a Three Year Learning Plan
Often a “point-in-time” campaign analysis misses the big picture. Effectively monitor and evaluate the impact of your efforts over time by setting learning goals that can be tested and proved out over multiple waves of your initiatives. Build long term testing into every effort to keep trying to beat the benchmarks for your most key measures of success.
If you’re under pressure to improve marketing results, these five best practices can improve your operations and drive to optimize. We invite you to take the next step to change your marketing processes to get to repeatable improvements in your marketing ROI.